Ever thought about why altcoins can bleed while Bitcoin barely moves? Or why traders start talking about BTC dominance every time the market gets nervous?
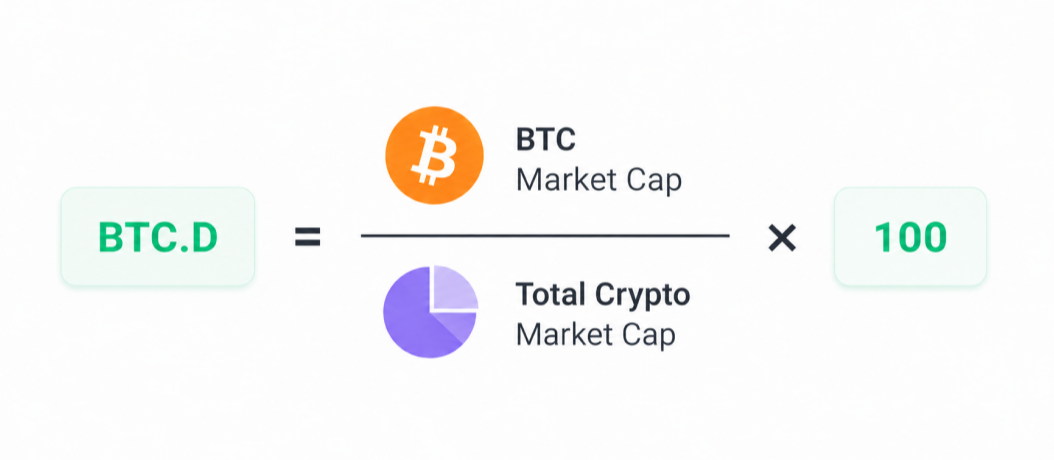
BTC dominance shows Bitcoin’s share of the total crypto market cap. If BTC dominance is 55%, Bitcoin makes up 55% of the market value tracked across crypto assets.
The number looks straightforward until capital starts rotating across the market.
Periodically, Bitcoin leads the market higher. In other phases, altcoins collapse faster and push BTC.D up during weak BTC price action.
The same rotation works in reverse during altcoin season: traders move deeper into ETH, large-cap alts, and higher-risk sectors, and BTC dominance starts losing ground.
Traders still watch the chart in 2026 because these rotations keep coming back.
The metric comes in handy once it stops looking like a simple “Bitcoin vs altcoins” score.
Key Takeaways
The metric shows where market cap and trader attention are concentrating
Rising BTC.D often means altcoins are getting weaker faster than Bitcoin, especially during panic rotations and leverage wipes.
Falling BTC.D does not automatically confirm altseason because stablecoins, meme pumps, and low-float coins can distort the percentage.
Disclaimer: BTC dominance tracks market share, not guaranteed future price direction. The chart makes more sense next to liquidity, stablecoin flows, exchange volume, and market structure.
BTC Dominance Today
The percentage moves when Bitcoin, ETH, stablecoins, or altcoins shift the market cap balance.
CoinMarketCap tracks Bitcoin dominance as Bitcoin’s share of the total crypto market capitalization.
When Bitcoin grows faster than the rest of the market, BTC.D rises. When capital rotates into ETH, altcoins, or stablecoins faster than into Bitcoin, the percentage usually falls.
In 2026, traders usually read BTC dominance next to:
Bitcoin market cap comes from BTC price multiplied by circulating supply.
The denominator includes Bitcoin, ETH, stablecoins, meme coins, AI tokens, infra coins, and thousands of smaller assets.
Putting it bluntly, the denominator matters more than many beginners expect.
A large stablecoin mint can move BTC dominance. A wave of low-float meme coins can move it too. Market cap growth does not always mean fresh liquidity entered the market.
Many traders avoid reading the metric alone for this reason.
BTC Dominance Chart Explained
The video above gives a simple visual explanation of how Bitcoin dominance works and why capital often moves between Bitcoin and altcoins in cycles.
A rising chart usually means Bitcoin holds market share better than altcoins.
A falling chart often means traders are rotating harder into ETH, altcoins, meme coins, or stablecoins.
Bitcoin can rally while BTC dominance falls if altcoins are running even faster.
The opposite can happen too. Bitcoin can drop while BTC dominance rises because altcoins are taking a harder hit.
Bitcoin’s role as the market liquidity anchor is one reason many traders still debate whether BTC remains a good long-term investment during broader crypto rotations.
Many traders compare the move against:
BTC price action
ETH dominance
altcoin volume
stablecoin inflows
perpetual futures funding
The cleanest read comes when several signals point in the same direction.
BTC dominance moves when the market cap balance shifts between Bitcoin and the rest of crypto.
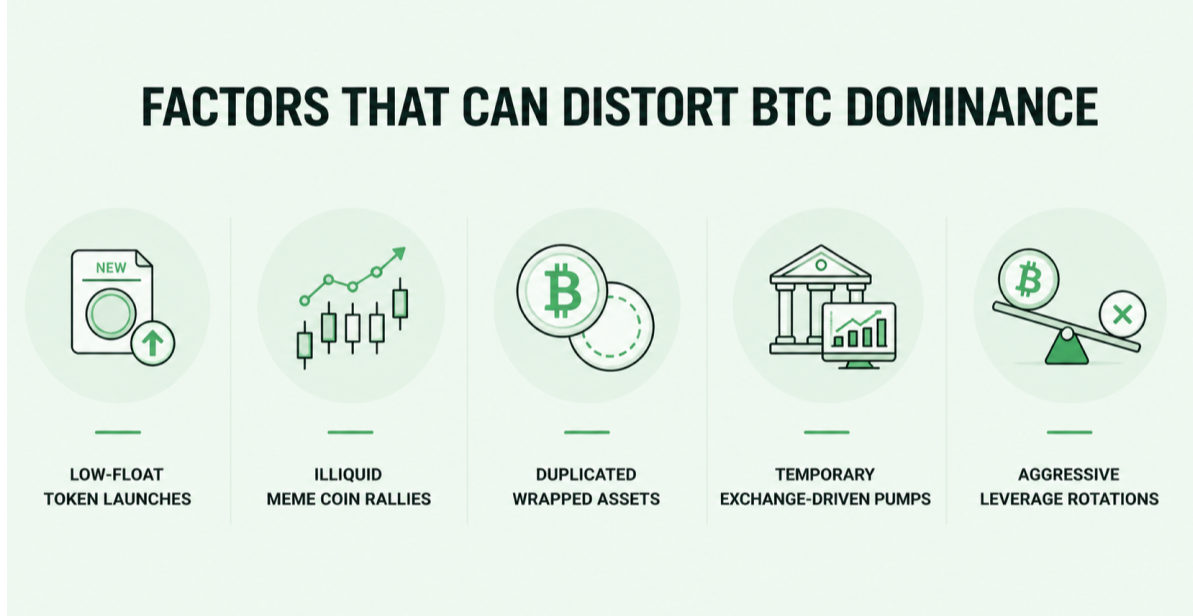
Common triggers include:
Market fear: altcoins often lose liquidity faster during leverage flushes, meme coin collapses, and macro risk-off moves.
Altcoin rotations: ETH, large-cap alts, DeFi, gaming, AI, and meme coins can pull market share away from Bitcoin during stronger risk-on phases.
Stablecoin flows: USDT and USDC can expand the total crypto market cap denominator and push BTC.D lower without a clean altcoin rally.
Low-float pumps: thinly traded tokens can add paper market cap faster than real liquidity.
Exchange-driven moves: listings, temporary volume spikes, and leverage rotations can distort the chart for short periods.
The setup gets easier to read when these factors line up with BTC price, ETH/BTC, funding, sector breadth, and spot volume.
During defensive market phases, traders often rotate back toward Bitcoin while miners continue securing the network regardless of short-term altcoin volatility. Local regulation still matters though, especially for large-scale operations and power access. Bitcoin mining laws and restrictions can still affect regional market sentiment and infrastructure growth.
Bitcoin Dominance vs Altcoin Season: The Main Difference
Many traders see dominance falling and call altcoin season too early.
The link is real, but the signal is incomplete.
A few large meme rallies can drag BTC dominance lower without lifting the broader altcoin market. Thin liquidity can inflate market caps fast during speculative rotations.
Stronger altcoin cycles usually spread across several areas:
ETH
large-cap alts
DeFi
infrastructure
mid-caps
perpetual futures volume
The market rarely flips from “Bitcoin only” to “everything pumps” overnight. Anyone who has traded an alt cycle knows the fakeouts can be brutal.
BTC dominance tracks relative market share and doesn’t confirm direct trade entries.
Bitcoin can rise while BTC.D falls. Bitcoin can fall while BTC.D rises. Traders who ignore price structure, liquidity, and volume can misread the setup fast.
2. Ignoring Stablecoin Market Cap
Stablecoin growth changes the denominator behind BTC dominance.
Large USDT or USDC inflows can push BTC.D lower without broad altcoin participation.
3. Confusing Meme Pumps With Broad Altcoin Strength
A few viral charts do not make a healthy altcoin market.
Broad participation typically matters more than isolated pumps.
The percentage can move for reasons that have little to do with real Bitcoin demand.
A thin meme coin pump, a noisy listing, or a leverage wipe can move the percentage before traders can actually exit size.
So the chart needs a second look: who is buying, where the volume sits, and whether the order books can handle real trades.
How Traders Actually Use BTC Dominance
BTC dominance works better as market context than as a standalone signal.
Many traders use the metric to see where attention and liquidity are clustering.
Signal
Typical Market Read
BTC price + BTC.D rising
Bitcoin controls flows
BTC price rising + BTC.D falling
Altcoins running faster
BTC price falling + BTC.D rising
Altcoins getting hit harder
BTC.D falling + stablecoin dominance rising
Risk stays defensive
The chart gets more useful next to:
ETH/BTC
exchange flows
stablecoin dominance
funding rates
sector breadth
spot volume
No single metric explains the entire market.
Final Takeaway
The metric remains relevant in 2026 because it shows where capital is actually crowding: Bitcoin, stablecoins, or higher-risk alts.
BTC.D gets interesting when the chart lines up with BTC price, ETH/BTC, funding, liquidity, and sector strength; without that context, one percentage can make a weak setup look stronger than it is.
FAQ
No. BTC dominance does not predict Bitcoin price. It only shows Bitcoin’s share of the total crypto market.
BTC dominance changes because Bitcoin, altcoins, stablecoins, and total crypto market cap move all day.
Yes. BTC dominance can rise while Bitcoin falls if altcoins fall harder than BTC.
Yes. BTC dominance can fall while Bitcoin rises if altcoins grow faster than BTC.
No. Beginners should not trade from BTC dominance alone. BTC.D needs price, volume, liquidity, and market breadth for context.
Platforms use different token lists, supply data, wrapped asset rules, and market cap methods. Small differences between CoinMarketCap, CoinGecko, TradingView, and CoinStats are normal.
Ethereum’s network activity is hitting ATHs, yet its token price recently collapsed to a multi-year low. Is this a temporary market shakeout ahead of the next major upgrade, or is ETH's economic model fundamentally broken?
Most crypto projects added an AI narrative after the market decided AI was the next big thing. NEAR Protocol had founders with machine learning backgrounds years before that trend existed.
An objective, data-driven Cardano price prediction for 2026–2030. We analyze ADA's developer activity, DeFi metrics, and upcoming network upgrades to map out realistic market scenarios.